|
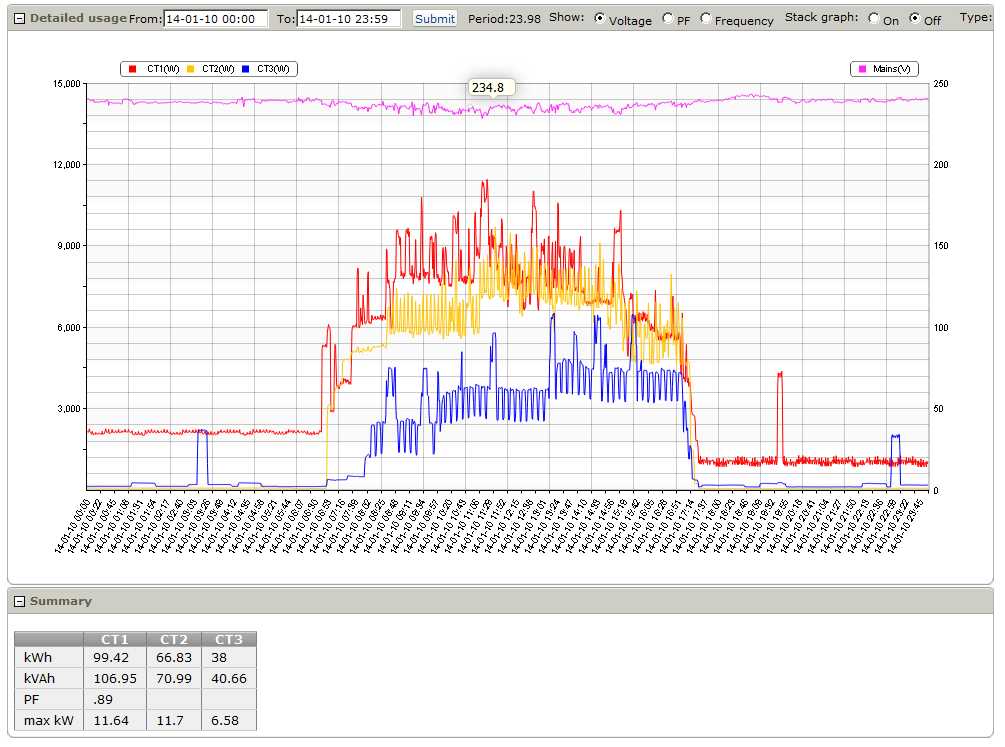
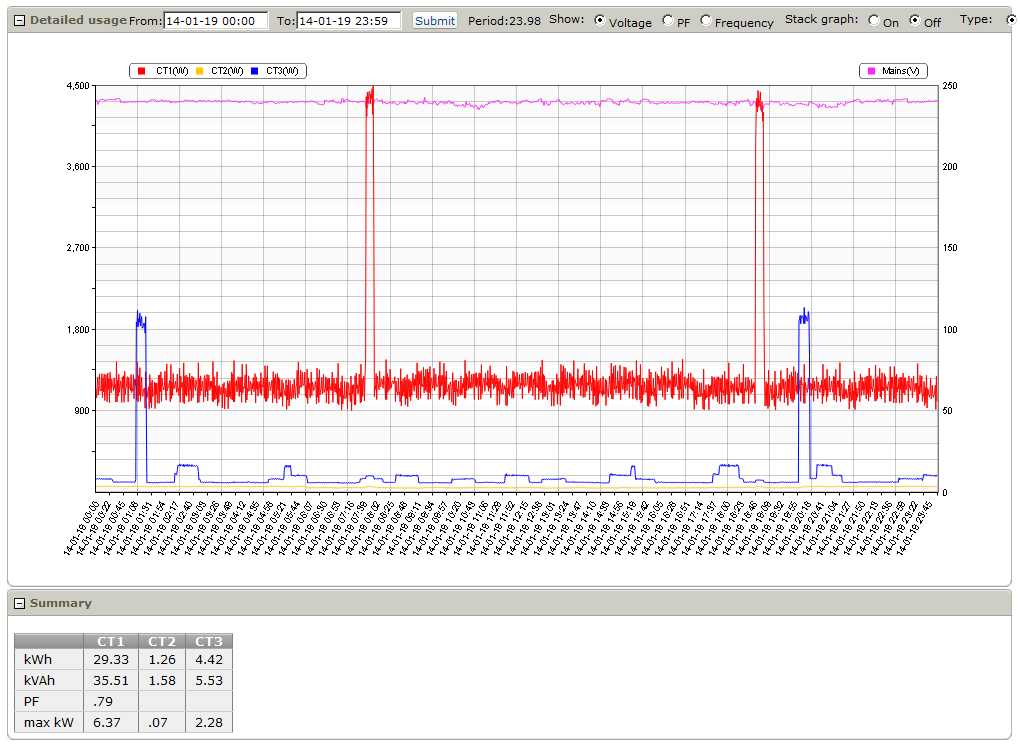
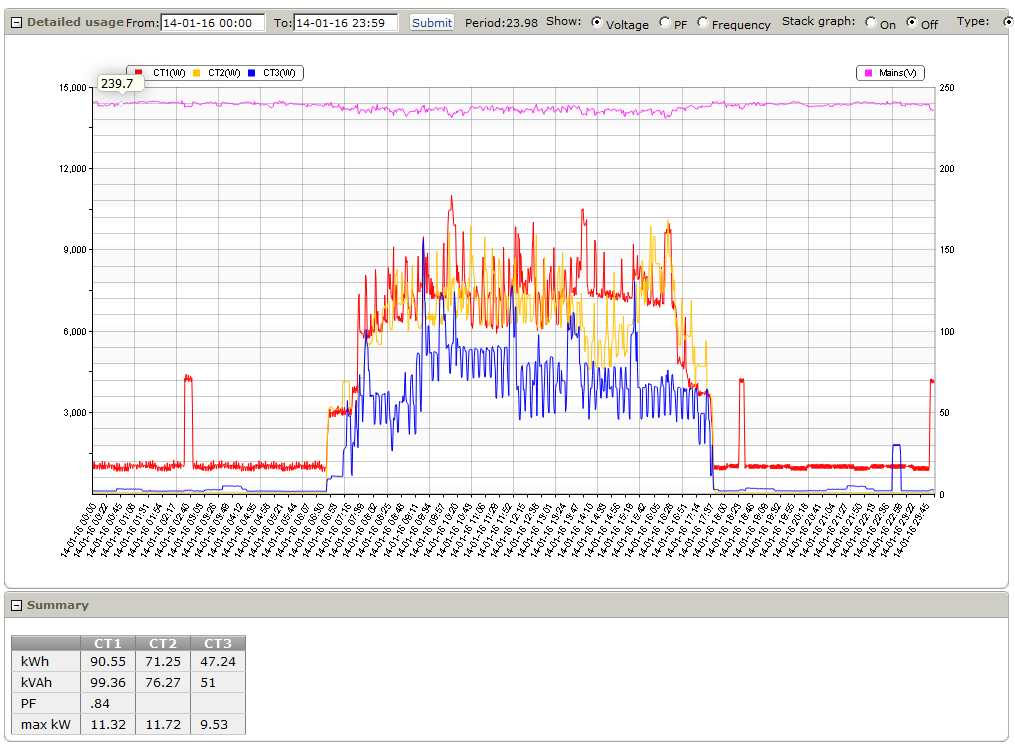
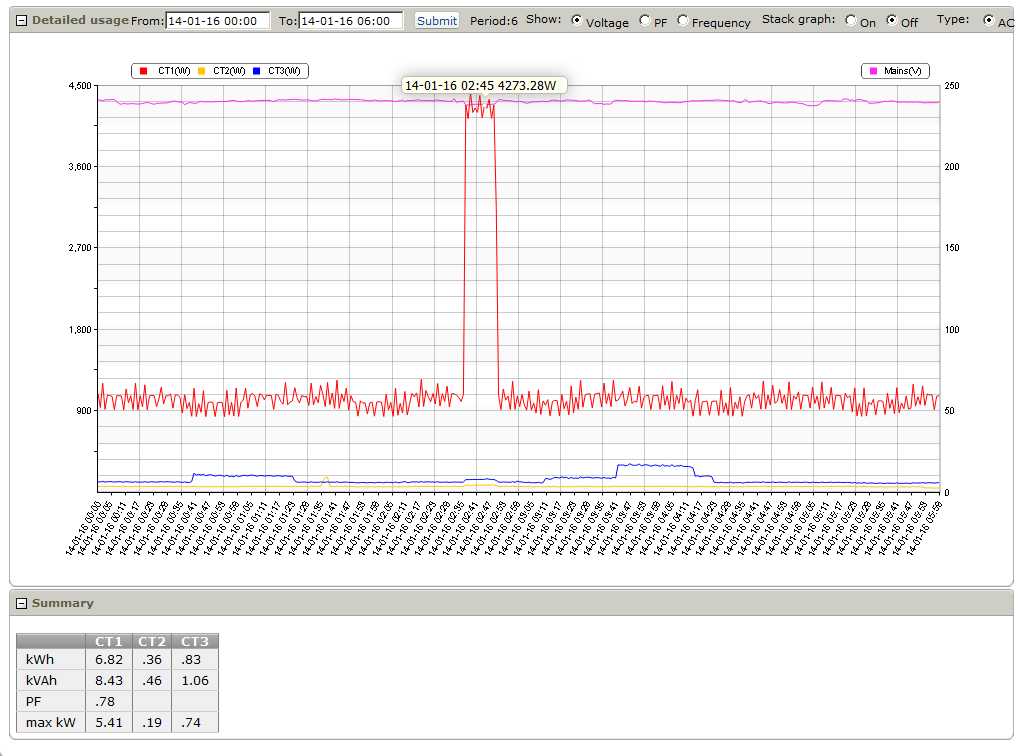
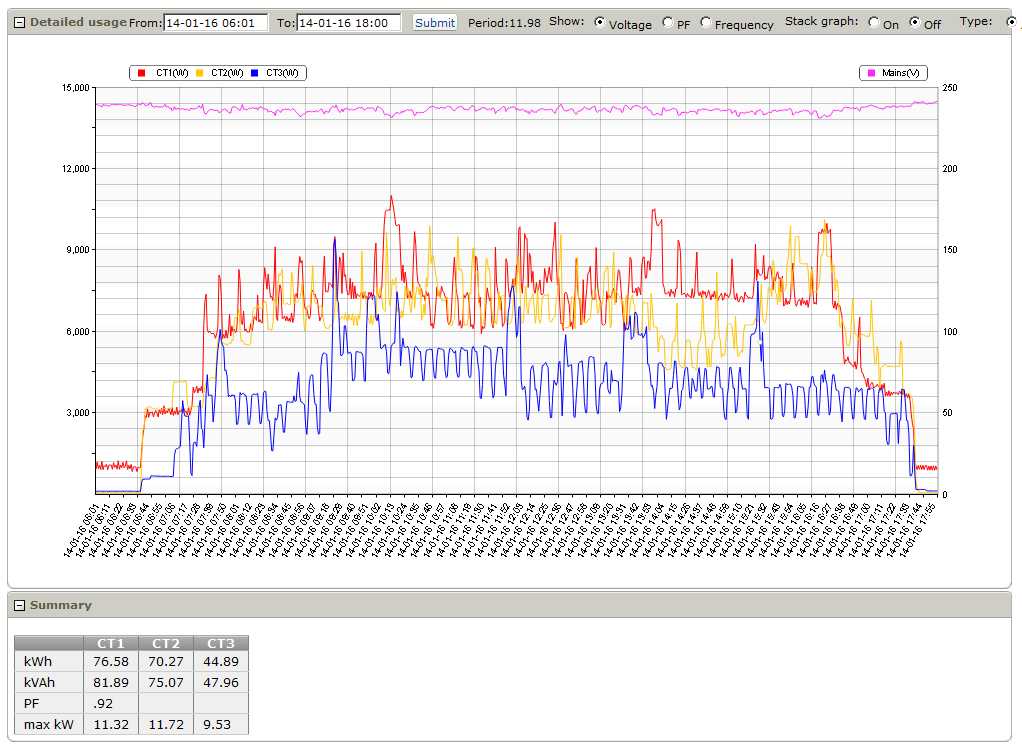
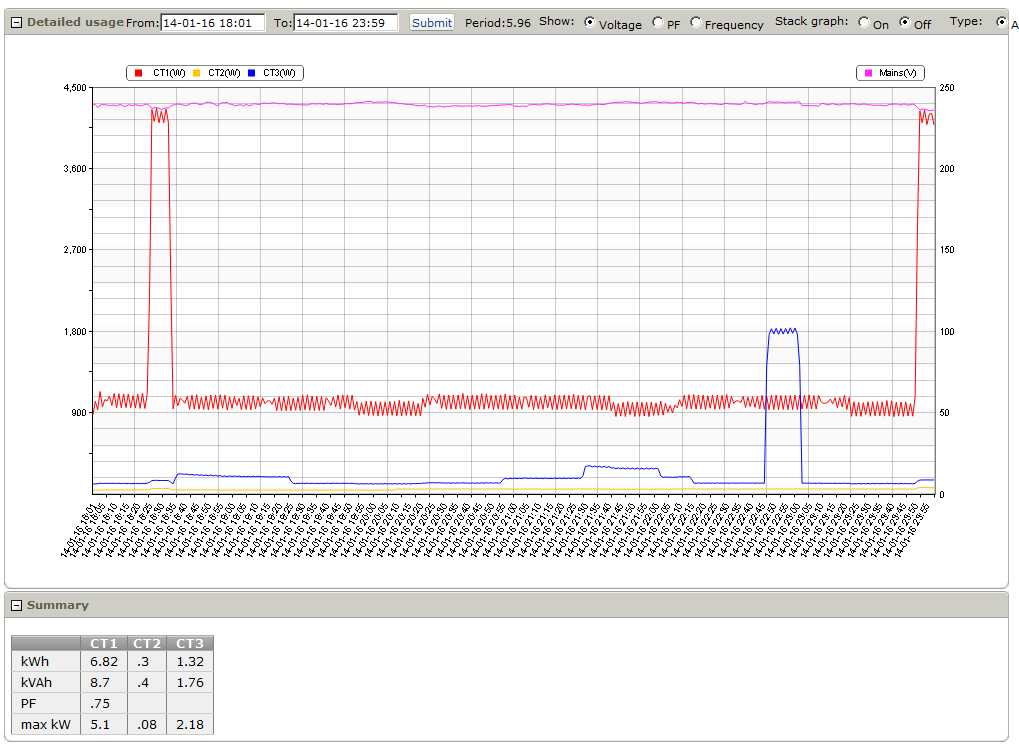
ExSolar can perform an energy audit at your premises by installing our very own Smart Energy Monitor for a period of time in order to monitor your energy usage. To get an efficient profile of your energy usage, we usually install the monitor for a week to two-week period. It is connected to our online webserver in order for us to track the data from any location with the access to the internet. Edit 22/01/24: Please note the ExSolar Smart Energy Monitor has been upgraded to the newer PiMX/GX device Please see the sample report below: Total Consumption for period 07-01-2014 to 24-01-2014 Total consumption for period shown 1967kWh (3-Phases combined) CT1 = Red Bar Graph = 1350kWh CT2 = Yellow Bar Graph = 963kWh CT3 = Blue Bar Graph = 653kWh The phases are hence fairly well balanced. Day of Most Usage (10-01-2014) (Friday) Day of Least Usage 19-01-2014 (Sunday) Day of Average Usage (day picked was 16-01-2014) (Thursday) Night Usage on Average Day (16-01-2014) Base Load is approximately 900W (red phase) Daytime Usage (06:01 to 18:00) on Average Day (16-01-2014) Peak load on red phase = approx. 11kW (red phase) Evening Usage (18:01 to 23:59) on Average Day (16-01-2014) Base load approximately 900W (red phase)
The above data is only a summary; full data is available online on the website with the accountset up for the customer. NOTE: Only Internet Explorer later than 9.3 will support the html5 canvas correctly. Otherwise anything else including ipad, iphone, Firefox, Chrome, Safari etc will work.
0 Comments
Your comment will be posted after it is approved.
Leave a Reply. |
AuthorsMarketing Manager for ExSolar Solar Solutions Archives
May 2024
|


